Benford’s Law – From February 2021 to the end of August 2021

I never actually drop projects, I just don’t update them for a while.

So let us return to the Benford’s Law project, with information about the first digits in the top news article on the BBC website on 26 out of the 31 days of August 2021. In those 26 articles, there were 398 numbers with leading digits. That’s ~ 15 per day, which about the same as June, but more than July.

Most of those numbers came from the article on the 8th of August (https://www.bbc.co.uk/sport/olympics/58112331) which was about the performance of different sports at the Tokyo Olympics compared to their funding.

August-only

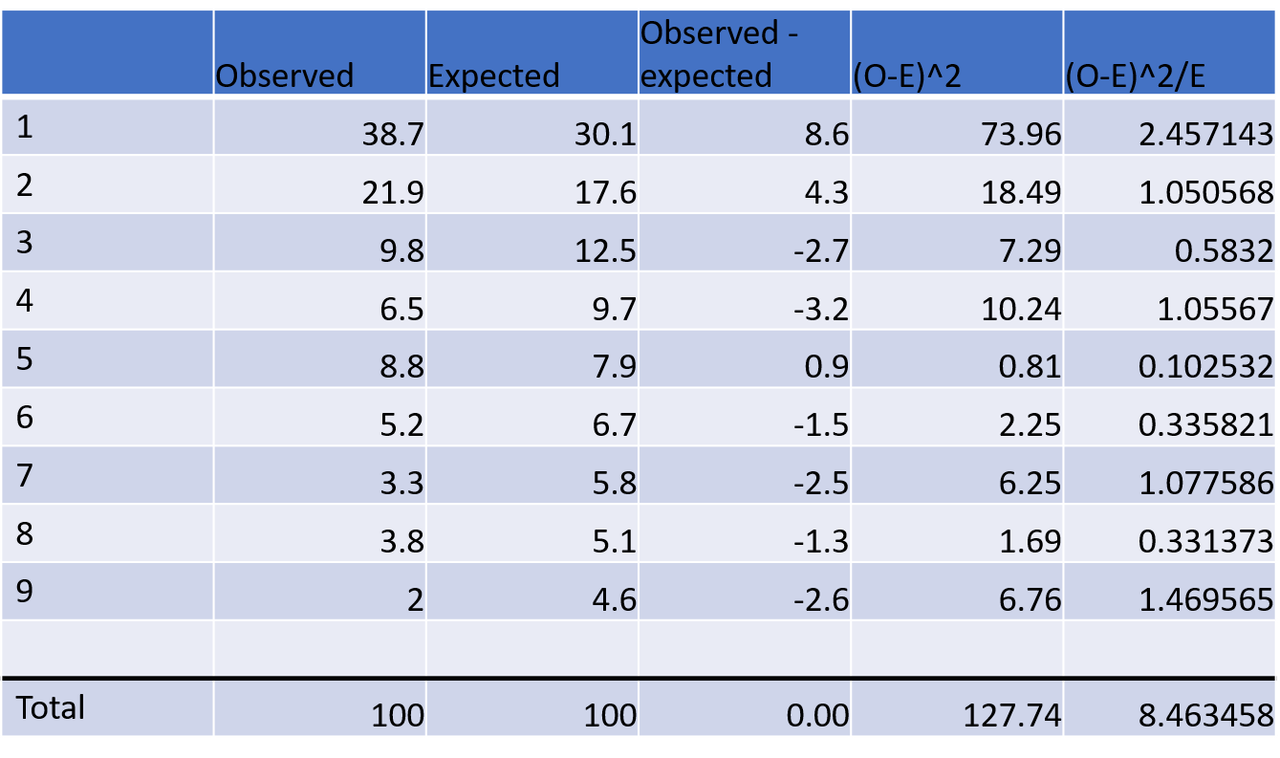
No number appeared exactly as often as expected, 5 was the closest, but even that was 1% away from expected. 1 and 2 are the most different to their expected values, both are over-represented. If you add together the sum of all the values of (observed-expected)squared, all divided by the expected, the calculated test statistic is 8.5, the highest since February itself.

The critical chi squared value for 9 items with only one line is ~ 15.507

The test statistic smaller than the critical value therefore the difference is not significant. This data does not disobey Benford’s Law.

If we look at the rolling total from February to the end of August, there have been 2258 numbers with leading digits.

February-to-August

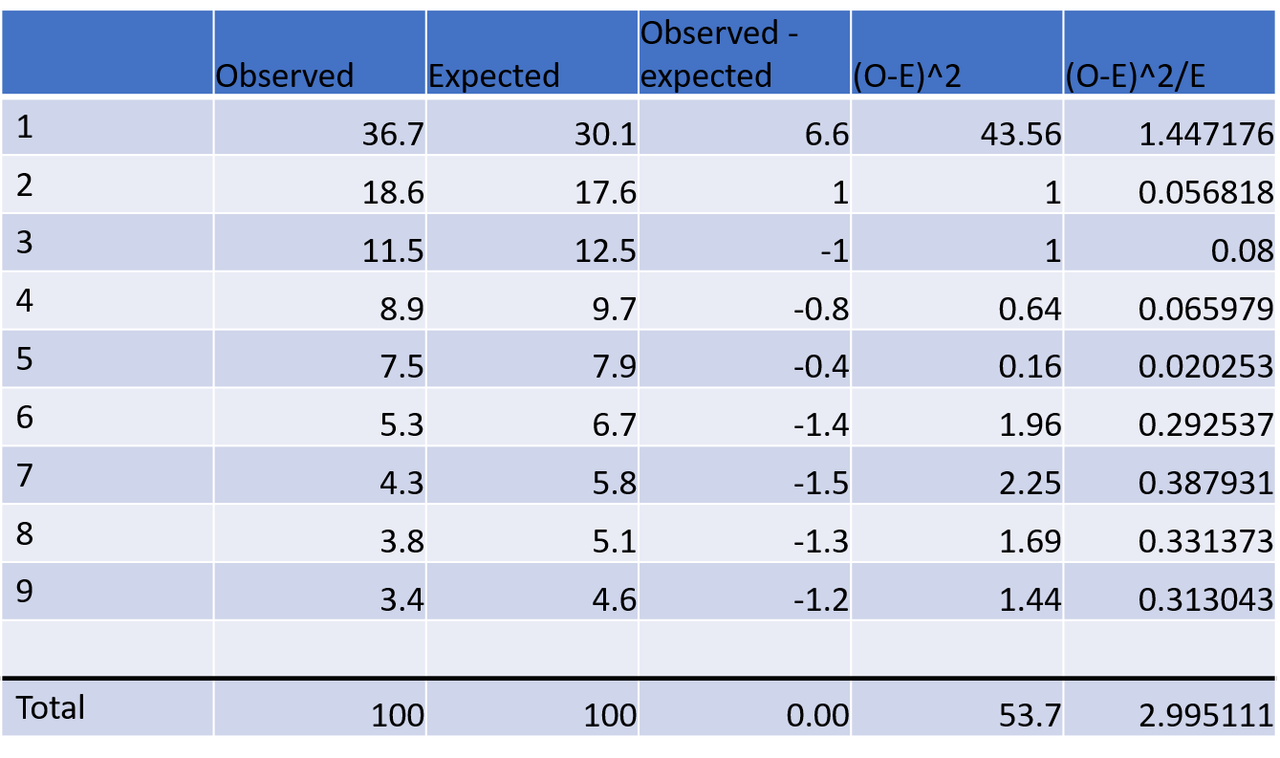
No number exactly its expected value, 5 is the closest. 1 is the number furthest away from its expected value and remains over-represented. If you add together the sum of all the values of (observed-expected) squared, all divided by the expected, the calculated test statistic is 3.00, not reducing the way it should do with the addition of more first digits that obey Benford’s Law. However, as the critical chi squared value for 9 items with only one line is ~ 15.507, the test statistic smaller than the critical value therefore the difference is not significant. This data does not disobey Benford’s Law.

The test statistic continues to fluctuate rather than reduce, which is interesting.

Benford’s Law – From February 2021 to the end of July 2021

Today’s post was supposed to be about cycling, and withdrawals from the Giro Rosa/Giro d’Italia Femminile compared to withdrawals in the men’s Tour de France, but it requires more prose than I am presently capable of (running fencing competitions takes it out of you). Instead, let us return to an update to the Benford’s Law project which has been chugging along in the background.

In July, I recorded the first digits in the top news article on the BBC website on 25/31 days. In those 25 articles, there were 261 numbers with leading digits. That’s 10-11 per day, which is a less than February but the same as March and May.

Table of numbers, explanation below
July numbers

No number appeared exactly as often as expected, 8 was the closest, only 0.1% away from expected. 1 and 7 are the most different to their expected values with 1 being over-represented and 7 under-represented. If you add together the sum of all the values of (observed-expected)squared, all divided by the expected, the calculated test statistic is 3.6, the lowest monthly total so far.

The critical chi squared value for 9 items with only one line is ~ 15.507

The test statistic smaller than the critical value therefore the difference is not significant. This data does not disobey Benford’s Law.

If we look at the rolling total from February to the end of June, there have been 1860 numbers with leading digits.

Rolling total from February to July, explanation below
Rolling total from February to July

No number exactly its expected value. 1 is the number furthest away from its expected value and remains over-represented. If you add together the sum of all the values of (observed-expected) squared, all divided by the expected, the calculated test statistic is 2.45, reducing as it should with more numbers.

The critical chi squared value for 9 items with only one line is ~ 15.507

The test statistic smaller than the critical value therefore the difference is not significant. This data does not disobey Benford’s Law.

This is a reduction from the test statistic of the total to May, but it’s not as low as it was in April.

Benford’s Law Posts – Back From A Break With May’s Results

This follows the three previous posts.

I was better at remembering to add the daily article in May, adding articles on 29 of 31 days.

Looking at May’s articles only, 313 leading digit numbers were used (10-11 per day, slightly more than April, about the same as March and less than February).

gG2T3m.png

3 is appearing the expected percentage of times. 1 and 7 are the most different to their expected values wth 1 being over-represented and 7 under-represented. If you add together the sum of all the values of (observed-expected)squared, all divided by the expected, the calculated test statistic is 6.67, slightly higher than April.

The critical chi squared value for 9 items with only one line is ~ 15.507

The test statistic smaller than the critical value therefore the difference is not significant. This data does not disobey Benford’s Law.

If we look at the rolling total from February to the end of May, there have been 1254 numbers with leading digits.

gG9KcP.png

2 and 3 are the numbers closest to their expected values. 1 is the number furthest away from its expected value and remains over-represented, the next furthest away is 6 which is under-represented. If you add together the sum of all the values of (observed-expected) squared, all divided by the expected, the calculated test statistic is 2.84.

The critical chi squared value for 9 items with only one line is ~ 15.507

The test statistic smaller than the critical value therefore the difference is not significant. This data does not disobey Benford’s Law.

Interestingly, as more numbers from articles added you would expect the calculated test statistic to reduce. Previously, it has (February = 8.6, February + March = 3.49, February + March + April = 2.29), but the test statistic has increased this time to 2.84, possibly explained by the articles from the 1st, 7th and 8th of May being very skewed towards the number 1 and having a lot of numbers in them.

Do April’s lead articles obey Benford’s Law? And how does the running total look?

This is the results of the third month of monitoring news articles for which numbers they contain (February results here, March results here).

I missed a couple more days in April, I blame Easter, and I will catch these up at the end of the year.

In the 27 days I did manage to capture, 232 numbers were used in the leading news articles on bbc.co.uk (~ 8 to 9 per day). This is slightly less than the 9-10 in March and a lot less than the 15 per day from February.

5SqgDO.png

9 is the number closest to its expected value. 2 is over-represented, 8 is under-represented. If you add together the sum of all the values of (observed-expected) squared, all divided by the expected, the calculated test statistic is 5.7.

The critical chi squared value for 9 items with only one line is ~ 15.507

The test statistic smaller than the critical value therefore the difference is not significant. This data does not disobey Benford’s Law.

If you look at the rolling total of February to the end of April, the numbers are starting to add up. Since the start of February, there have been 941 digits in headline news articles.

5SqSIx.png

5 is the number closest to its expected value. 1 remains over-represented, while 6 is under-represented. If you add together the sum of all the values of (observed-expected) squared, all divided by the expected, the calculated test statistic is 2.29.

The critical chi squared value for 9 items with only one line is ~ 15.507

The test statistic smaller than the critical value therefore the difference is not significant. This data does not disobey Benford’s Law.

Interestingly, as more numbers from articles have been added the calculated test statistic has reduced (February = 8.6, February + March = 3.49, February + March + April = 2.29). This is what you would expect to see if the numbers in the articles fulfill Benford’s law.

Do March’s lead articles obey Benford’s Law? And how does the running total look?

This is the results of the second month of monitoring news articles for which numbers they contain.

March featured the first days I missed (I blame Easter), so I will have to add two days on at the end of the year.

In the 29 days I did manage to capture, 273 numbers were used (~ 9 to 10 per day). This is less than the ~15 per day from February.

lVOyxG.png

1 and 8 are the closest to expected. 5 is over-represented. If you add together the sum of all the values of (observed-expected)squared, all divided by the expected, the calculated test statistic is 5.6.

The critical chi squared value for 9 items with only one line is ~ 15.507

The test statistic smaller than the critical value therefore the difference is not significant. This data does not disobey Benford’s Law.

If you look at the rolling total of February and March, the numbers are starting to add up. There were 709 digits in headline news articles.

lVhdjq.png

7 and 8 are the closest to expected. 1 remains over-represented, as it was in February. If you add together the sum of all the values of (observed-expected)squared, all divided by the expected, the calculated test statistic is 3.49.

The critical chi squared value for 9 items with only one line is ~ 15.507

The test statistic smaller than the critical value therefore the difference is not significant. This data does not disobey Benford’s Law.

Interestingly, as more numbers from articles have been added the calculated test statistic has reduced (February = 8.6, February + March = 3.49). This is what you would expect to see if the numbers in the articles fulfill Benford’s law.

Do February’s lead articles obey Benford’s Law?

Benford’s Law gains its power with larger numbers, and I started my Benford’s law project in the shortest month. I don’t think these things through, do I? But you have to start somewhere.

The 28 daily news articles contained 436 numbers written as numbers (~15 per day).

lU7Nbb.png

3 and 7 are found pretty much exactly as often as expected. 1 is over represented.

If you add together the sum of all the values of (observed-expected)squared, all divided by the expected, the calculated test statistic is 8.6.

The critical chi squared value for 9 items with only one line is ~ 15.507

The test statistic smaller than the critical value therefore the difference is not significant. This data does not disobey Benford’s Law.*

*That noise is L shouting “obey is the word you want” but to me there’s a difference between ‘stats show x’ and ‘stats show not x’ and to me, these show ‘do not disobey’.

Obey Benford’s – It’s The Law (an introduction to my Benford’s Law project)

Introduction:

Some years ago, I became fascinated by Benford’s Law, thanks in part to Chapter 12 “Is it Fake?” of the excellent “How Long is a Piece of String?” More Hidden Mathematics of Everyday Life by Rob Eastaway” (as reviewed here). Excessively simplifying, in naturally occurring numbers, the leading digits will follow a distinct pattern, and will not be randomly distributed.

The expected % of leading numbers for each digit can be seen in the table below:

lsWciA.png

If you have a large naturally occurring data set that doesn’t conform to this, it tells you there are either constraints on it so that the data doesn’t cover all of the possibilities (e.g. human heights in m are will start with a 1 or a 2, no one has ever been 4 m tall) or something else is going on.

Testing this theory:

I wanted to test this out on something. Problem was, what? Most sports data is possibility-limited e.g. fewer goals will be scored in football the 9th or 9xths minute than would be scored in the 8th and 8xths minute, not because of the minute, but because the game stops at the 90th minute. Other data isn’t big enough. I needed a source of numbers that was large and unlimited.

Eventually, possibly in a fit of cynicism, I decided to try the leading digits of numbers reported in the news. Advantages to this plan – I can use a single, traceable data source – one article a day from the BBC news website. The BBC doesn’t tend to delete pages so if someone wanted to double check my numbers, I could give them the links.

Disadvantages to this plan – when I first attempted it, Article 50 was in the news, and skewing my results.

Having looked at the results, and realised this and a few methodological errors, and going a bit stir-crazy because of lockdown 3, I decided to try it again.

Attempt Number 2:

These were the rules I developed to try to avoid that and similar pitfalls:
1 – no numbers in names e.g. 19 in COVID-19 does not count as a leading digit
2 – no numbers from dates (I had done this originally, but worth restating)
3 – only digits written as digits. This threw up an unexpected problem – the BBC has somewhat intermittent editorial control on whether digits under 10 are written as words or numbers, and this may skew results. I’ve saved the links to the articles I’ve used to put the project together so I can go through them again if I want to (or if someone else wants to look at them).

I started on the 1st of February 2021, and will carry on till 1st of February 2022 (barring disaster). The other advantage of this system is that if I miss a day, I can fill them in with more days at the end. I will give monthly updates and running totals, plus some commentary if I have any.