L was slightly concerned that I hadn’t stated that I was a Saints fan quite loudly enough in my previous posts. I think it may become obvious throughout this summary of the Saints vs Salford match.
All winning runs have to come to an end, and 44 years is a pretty long time to not be beaten at home (https://www.bbc.co.uk/sport/rugby-league/68501496 / https://www.saintsrlfc.com/matches/2024/first-team/saints-v-salford-red-devils-2024-03-08/) and they needed Percival to get sent off for goodness knows what to beat Saints.
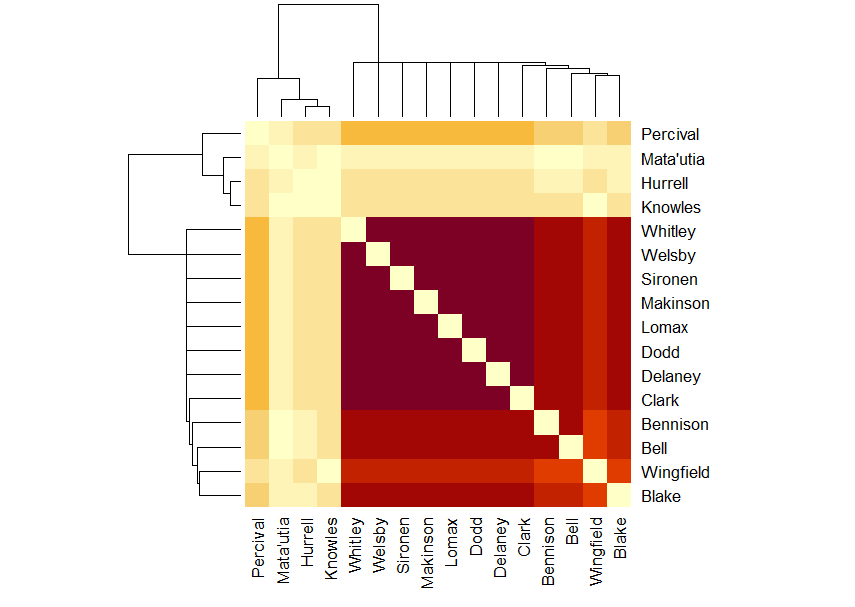
That does explain why Percival is, once again, alone in the dendrogram.
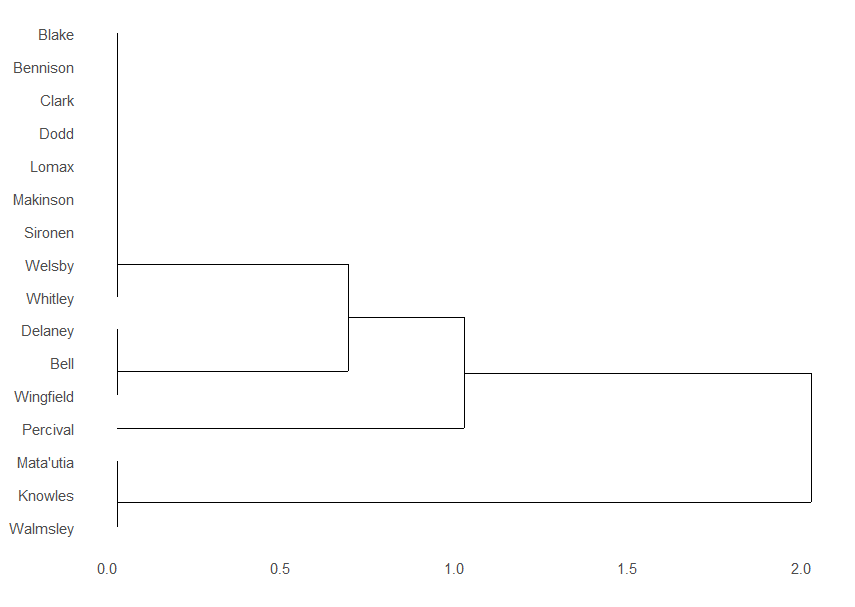
It shows you that Sironen put one heck of a shift in to cover for Saints being a man down.
This match has an interesting effect on the “up to the end of game 4” charts.
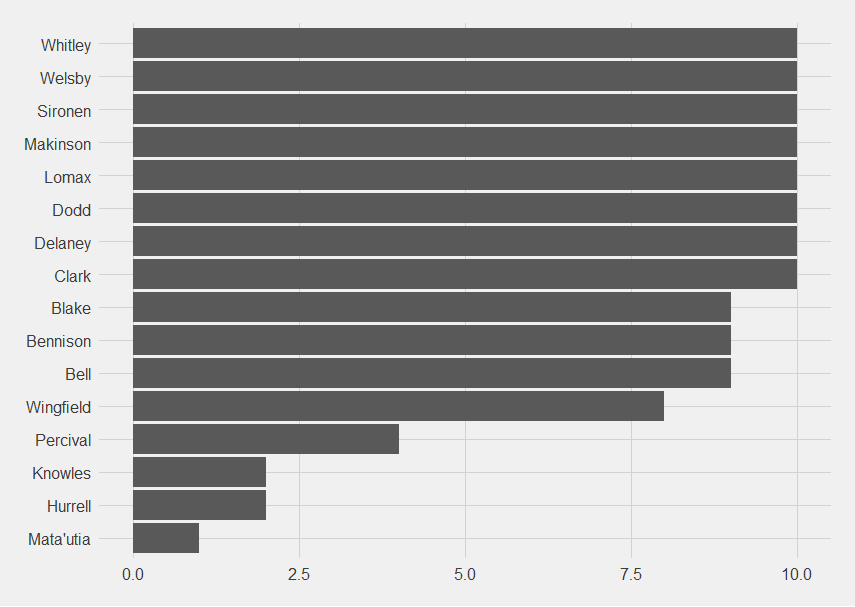
When Saints score still hasn’t really built up into an informative pile of data, but point-scorers (no division between tries and kicks) is starting to.
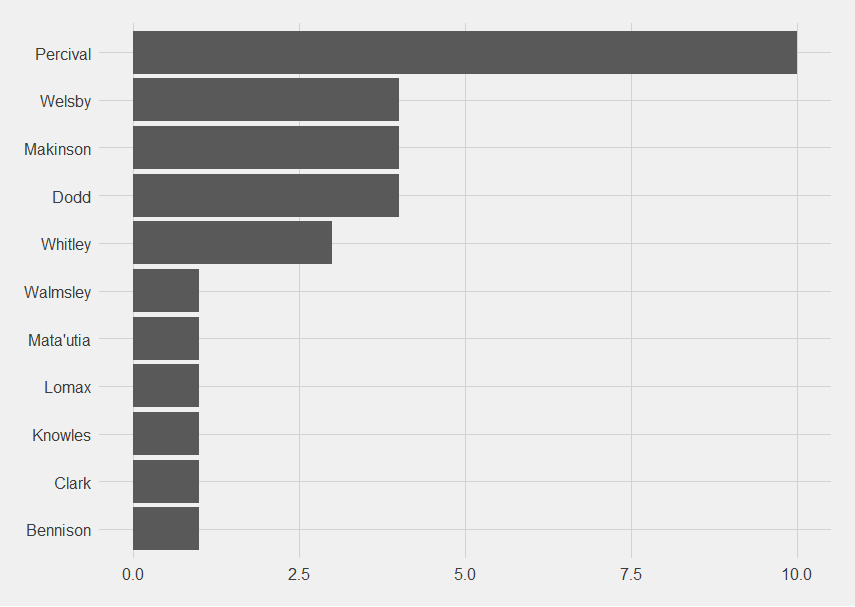
Percival having the most moments makes sense, with him being the kicker (if only he could convert more often), and Dodd and Makinson who can also kick makes sense, Welsby up there highlights his wonderful poaching abilities. Whitley on 3 is an unexpected bonus. He’s working out well so far, isn’t he?
Point-scoring moments present for also highlights those players, and makes it clear Clark is definitely first choice hooker.
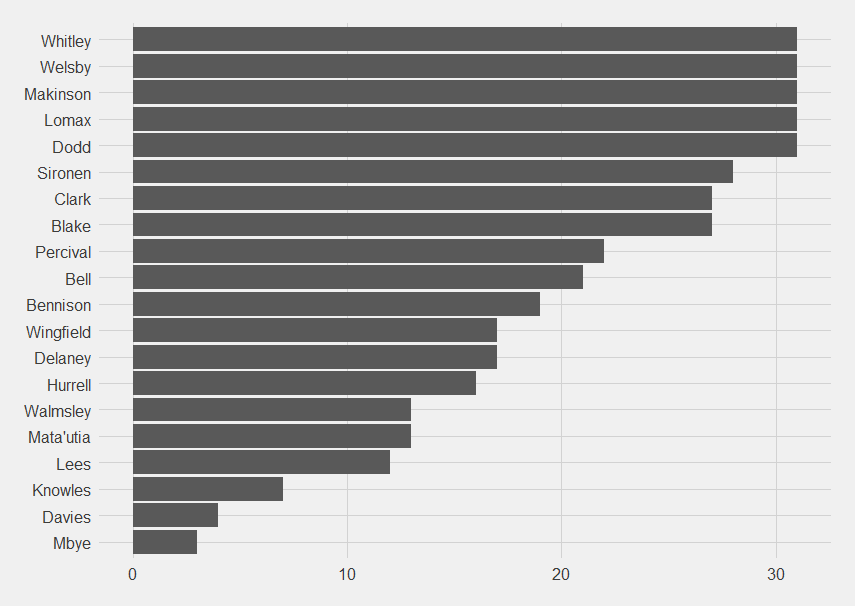
I do like how high up some of the academy grads are. I mean the most recent crop, not some of the older heads (help, Lomax is now an older head).
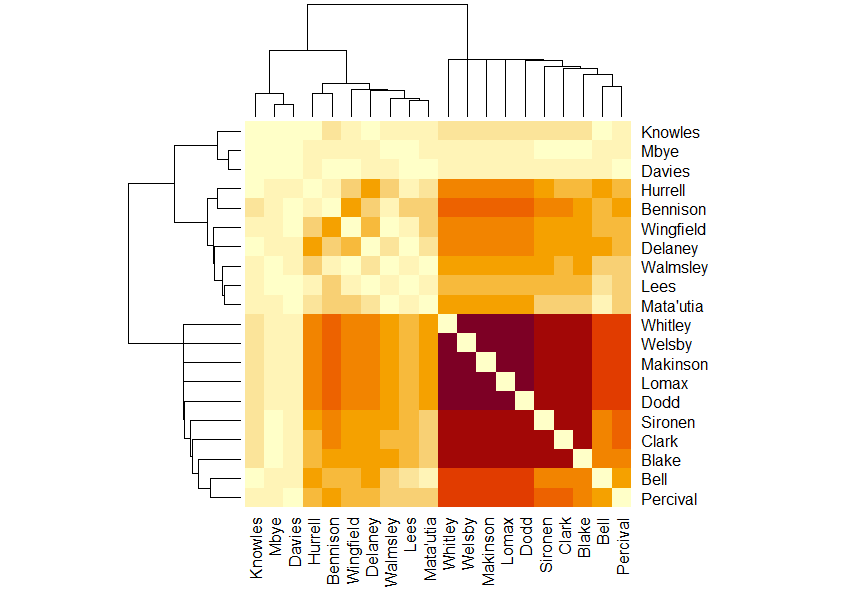
The matrix is starting to look complicated:
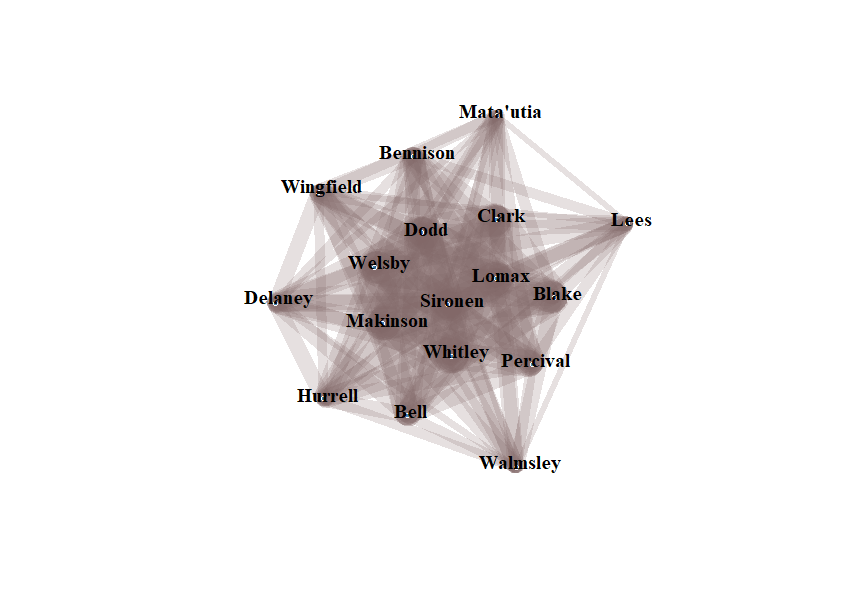
The network diagram does give a nice matchday 17 – Sironen, Dodd, Clark, Lomax, Blake, Percival, Whitley, Makinson, Welsby, Matautia, Lees, Walmsley, Bell, Hurrell, Delaney, Wingfield and Bennison.
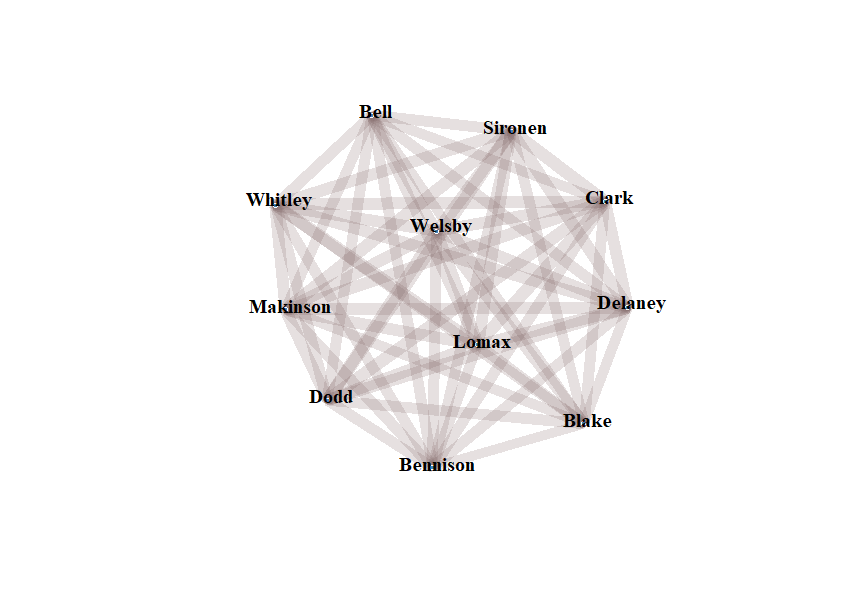
Because Salford scored several points, there’s now enough data to have some solid numbers for “players present when Saints concede”. The only problem is it won’t include Percival as much as it maybe should given his sending off was sort of responsible for some of the concessions.
Percival is also a darker colour than expected on the concession matrix.
The network diagram for players present when Saints concede only has 11 players on.
The diagrams are mostly making me appreciate Sironen at lot more.
There’s a reason why Saints fans rate him.

2 thoughts on “Saints Ahoy – Visualisations from game 4 and the season to date”