I told you I was trying to catch up with everything that I’d missed. I am aware I am 3 rugby league games (about to be four) and 2 F1 races behind.
The Leeds Rhinos vs St Helens Saints league game (https://www.saintsrlfc.com/matches/2024/first-team/leeds-rhinos-v-saints-2024-03-15/) was the first of two back-to-back games vs Leeds. Despite Leeds’s poor start to the season (by their standards), I was quite worried about this game.
Saints proceeded to not help matters by not turning up for the first quarter of the match.
When Saints conceded:
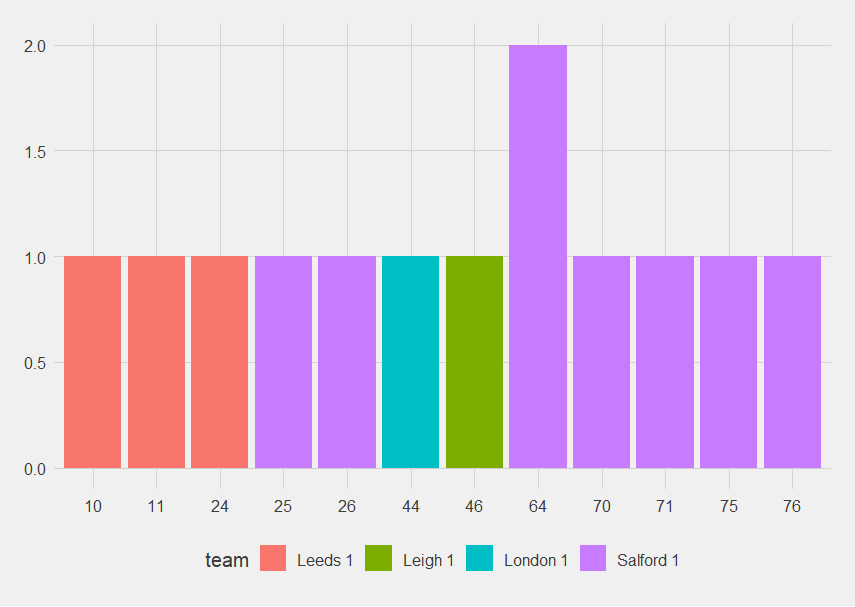
This match was also the first time the Saints live text has let me down. I know Mbye must have come on before he scored, but it didn’t say when, so there’s now going to be a slight * against him and Clark’s data (because if he came on for anyone, it was Clark as they are our hookers). The advantage to getting data over a whole season is that one oops ought to be watered down.
Who scored for Saints up to game 5?
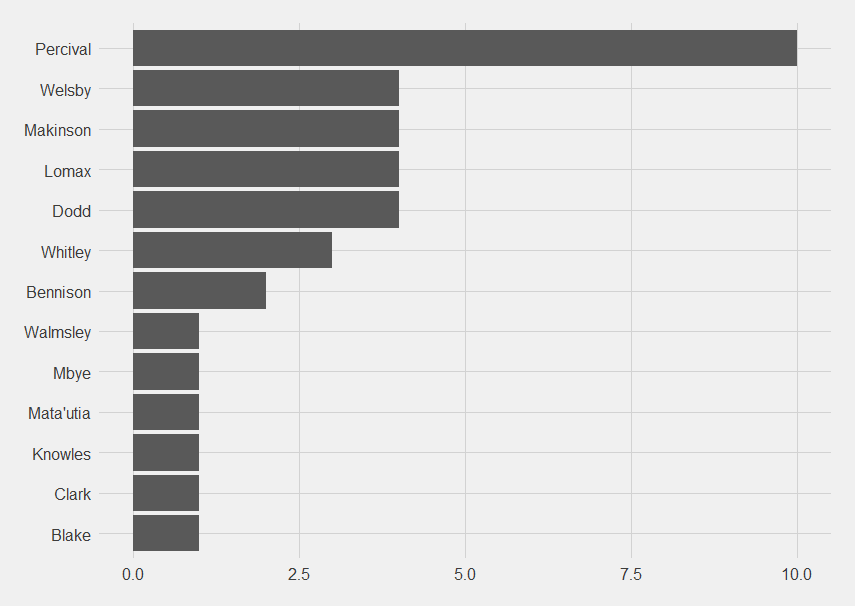
With Percival missing the game due to being sent off in the last game (https://fulltimesportsfan.wordpress.com/2024/04/05/saints-ahoy-visualisations-from-game-4-and-the-season-to-date/), Lomax took over the kicking duties, which is why he has risen so far up that bar chart.
Okay, let’s look at point-scoring moments players were present for:

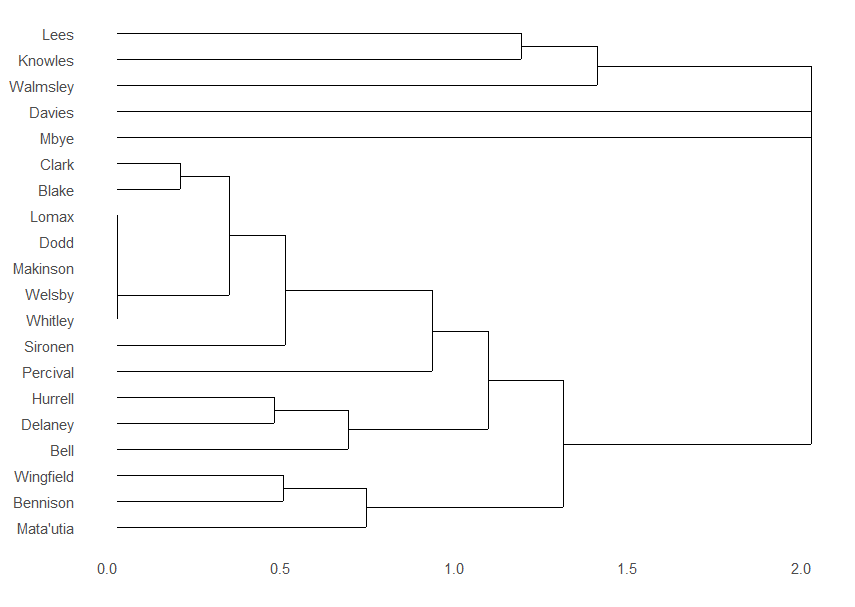
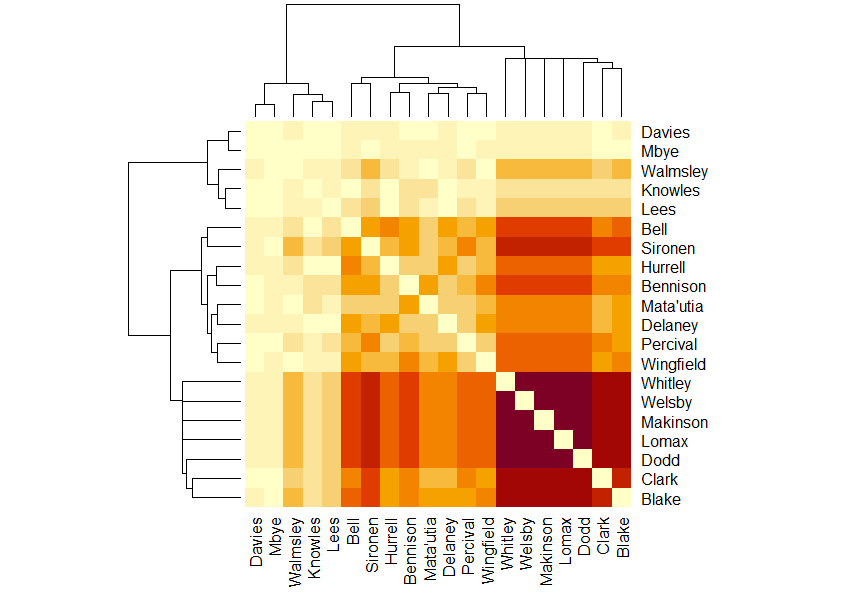
The dendrogram for when players are on the pitch together at Saints’s point-scoring moments has become more complex, there’s only really one true cluster left, of Lomax, Makinson, Dodd, Welsby and Whitley.
What is interesting is that there’s now two clear “families” of players, Lees, Knowles, Walmsley, Davies and Mbye in one, and everyone else in the other.
I know Lees and Knowles haven’t played as much as I would have expected, Davies barely at all, and Mbye only when they need to spell Clark, but I felt Walmsley had played more. So count one for stats telling you something you don’t feel.
On the other hand, the matrix diagram does have Walmsley in a darker colour than the others so maybe he is just very effective when he is on the pitch.
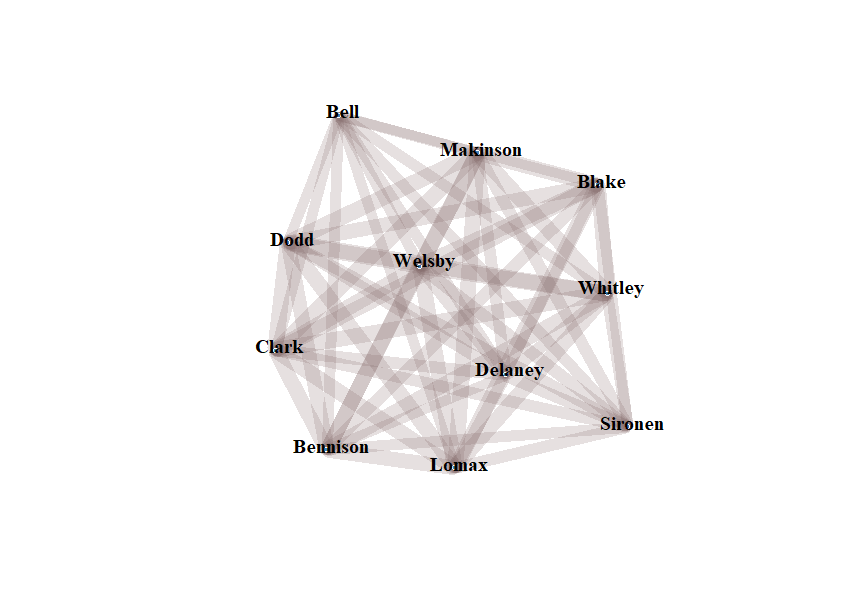
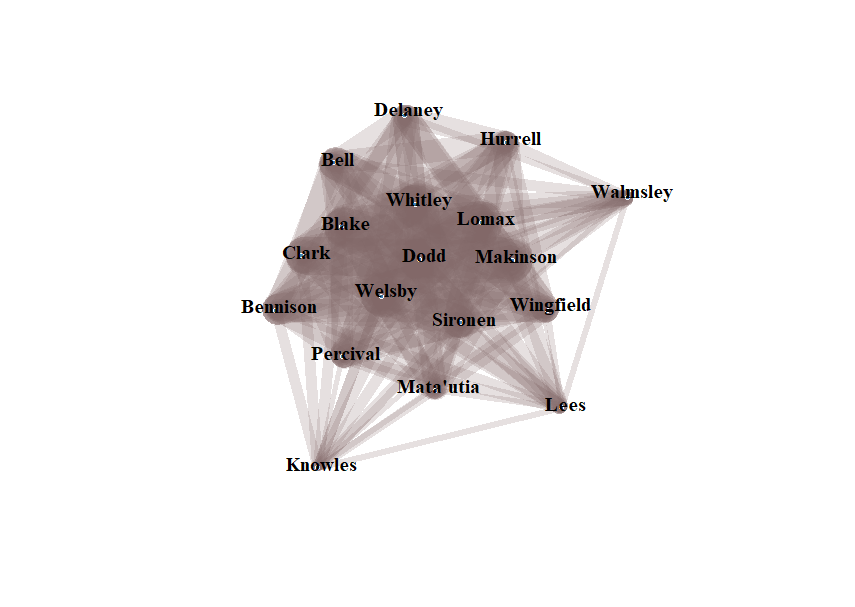
The network graph is now an interesting shape, with a central cluster with Walmsley, Lees and Knowles hanging off.
Looking at when Saints concede instead:
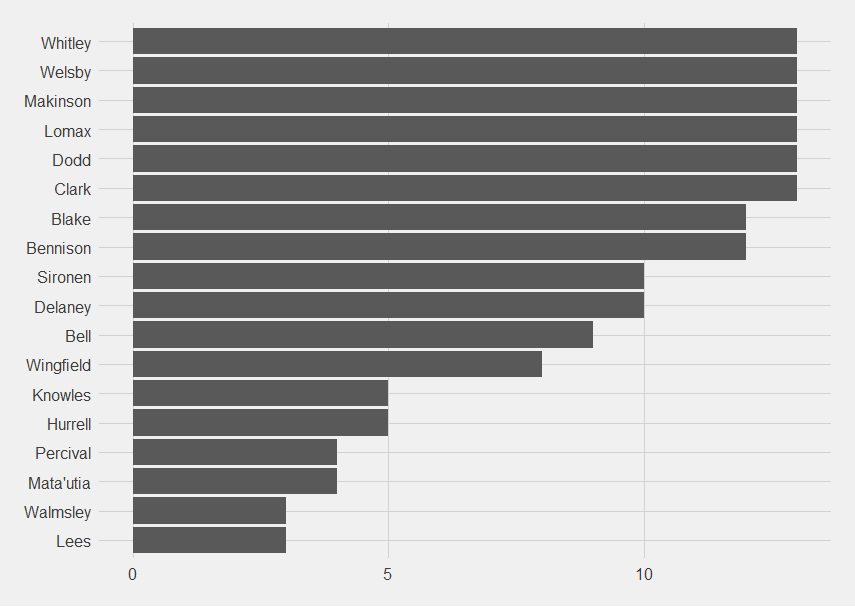
The players present for the most (Whitley, Welsby, Makinson, Lomax, Dodd and Clark) are the ones that have been present the most when Saints score, with the exception of Clark who is sometimes swapped out for Mbye.
Looking at the players present for the least, Walmsley and Lees are present for the least, with 3, then Percival and Matautia with 4 and Knowles and Hurrell for 5, I’m starting to wonder if I have anyway of looking at it divided by time played, because I know Percival was being subbed out at 50 mins even before the sending off.
The concession dendrogram has the same pattern as the bar chart.
The concession matrix has an interesting pattern of colours
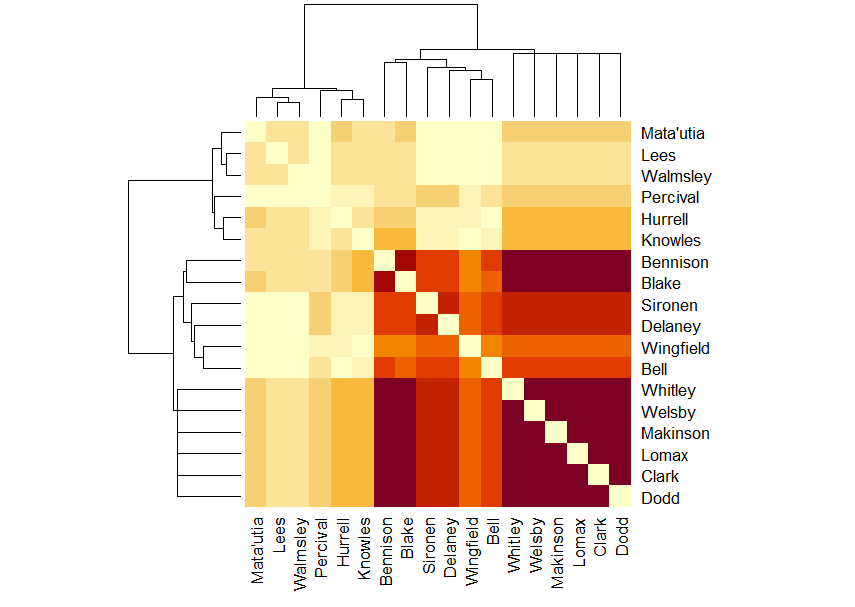
I was only expecting one really dark cluster, not two, and the points where Sironen, Delaney, Wingfield and Bell cross Matautia, Lees and Walmsley are so pale that it is clear that they do not play together, so I think we can really start to see who the forward pairings are when Saints concede. Wingfield and Knowles don’t play together, and neither do Bell and Hurrell.
That Percival doesn’t play with Matautia, Lees and Walmsley is unexpected.
There are still only 11 players on the “when Saints concede” network diagram,
