The road to explicableness – A closer look at England after their seventh World Cup game

I’ve spent the rest of these posts complaining that the diagrams of who plays with who when England score and concede make little sense.

Following the third place play-off match they have started to make more sense. I think it’s because it was the 4th match were Steve Borthwick was able to play his preferred team (built around his preferred fly-half and captain Owen Farrell) vs the three where he couldn’t due to Farrell’s suspension.

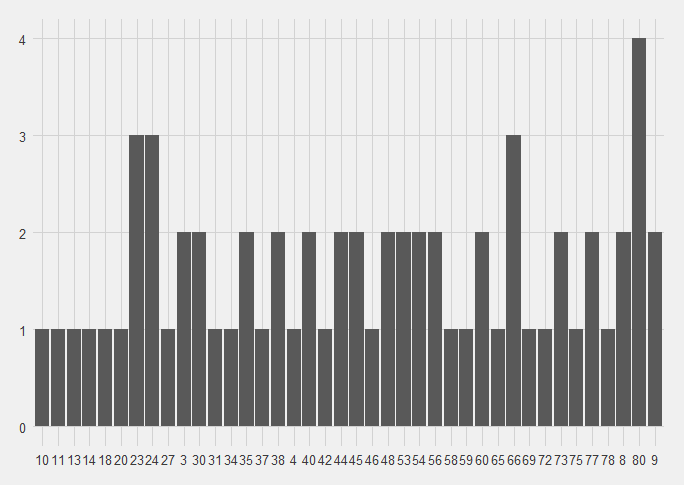
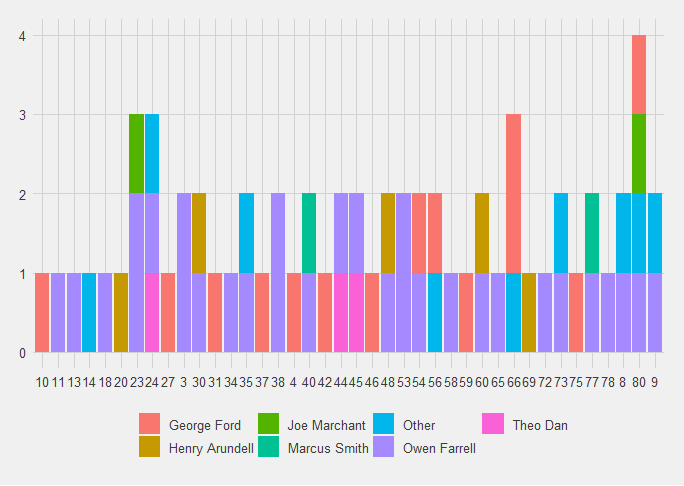
The “who scored”, and “when did they score” charts have always made sense.

Bar chart showing which players had the most point-scoring moments for England.  Owen Farrell has the largest bar with 30, far more than George Ford, in second with 14.
Bar chart showing when England had point scoring moments.  They are reasonably well distributed across the 80 minutes.
Same chart as before, coloured by which player scored.  Red-pink is George Ford, light brown is Henry Arundell, green is Joe Marchant, sort of teal is Marcus Smith, Owen Farrell is purple and bright pink is Theo Dan.  Points scored by others are in blue.  They are also evenly spread.

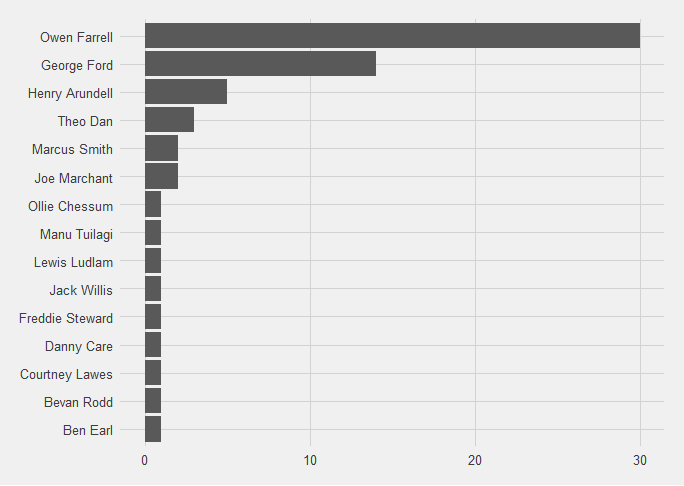
Of the 65 point-scoring moments for England, Ben Earl was present for the most (51/65), followed by Joe Marchant, Owen Farrell and Maro Itoje.

Bar chart showing which England players were on the pitch when they had point-scoring moments.  Important details are in the text.

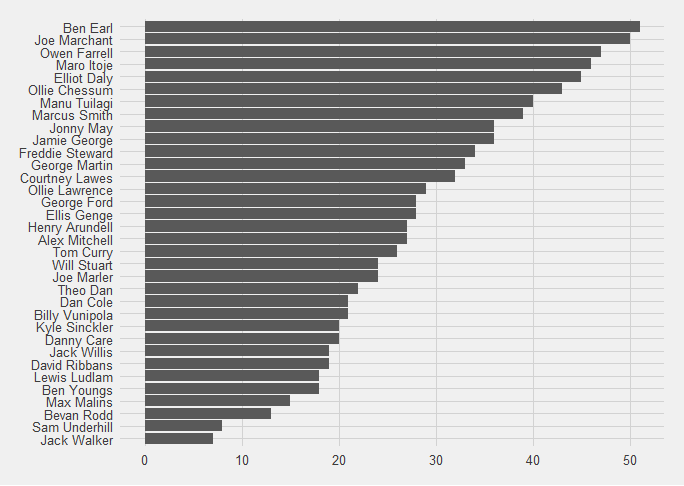
Jack Walker and Sam Underhill were present for the least (7 and 8 respectively), which makes sense because they only took part in 1 game each. Bevan Rodd was present for 13 over 2 games.

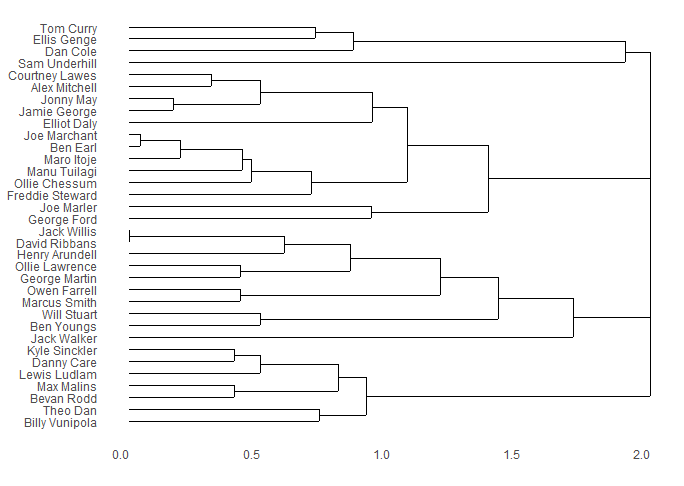
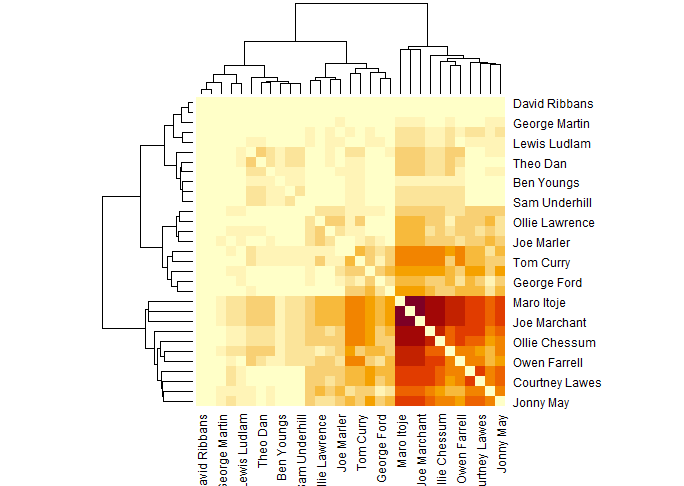
The dendrogram makes it clear how mix-and-matchy the squads put out were:

Dendrogram - almost no players are clustered together, with there only being 1 small cluster of Jack Willis and David Ribbans.

But the matrix network diagram now clearly shows who the “chosen 15” were, followed by the “sometimes” played and then, palest in the top left, the “I’m only playing you because I have to”.

Matrix diagram.  The darker colours (indicating players who play together) are in the bottom right, with the middle section looking like TV static, and then fading to pale in the top and left.

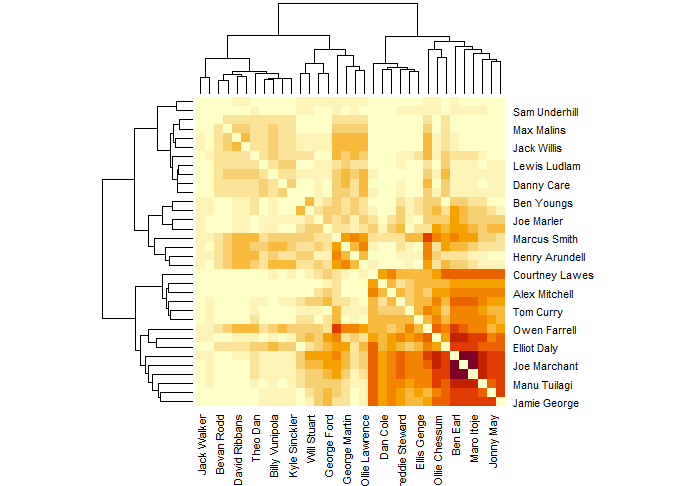
(I’m being slightly mean to Steve Borthwick there, it’s clear that he would have played Theo Dan only he’s an excellent future replacement for Jamie George when he retires, but Jamie George is still there)

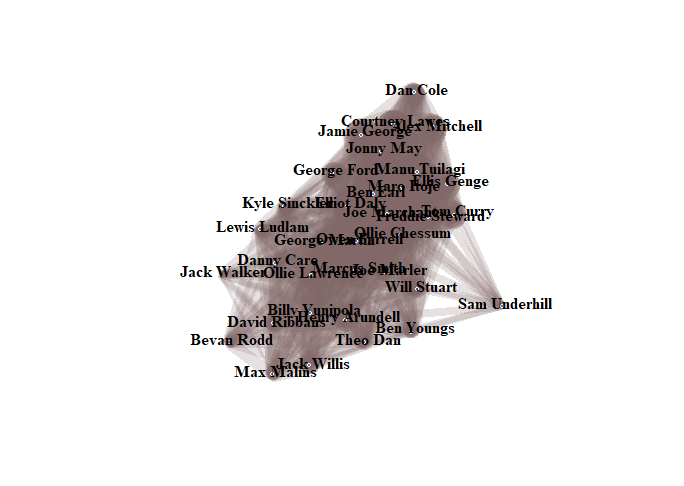
The network diagram is less clear, with a general mush with Underhill, Walker and Rodd the outliers.

Network diagram.  It's a giant mush, with Sam Underhill sticking out on the right hand side.  He is the clearest outlier, Jack Walker and Bevan Rodd stick out a little on the left and Dan Cole at the top of the diagram.

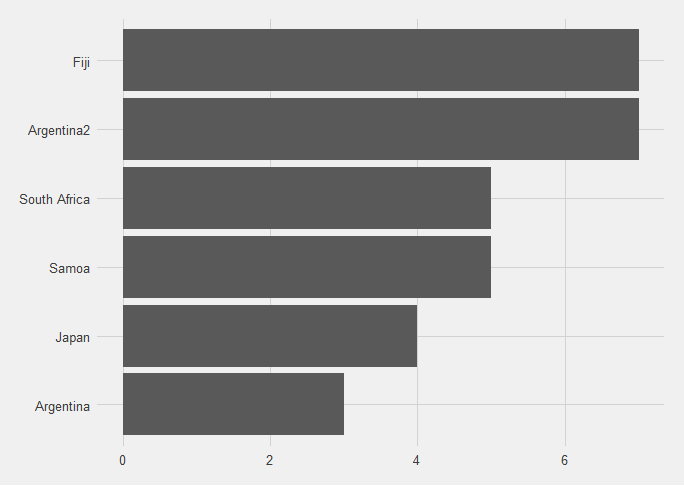
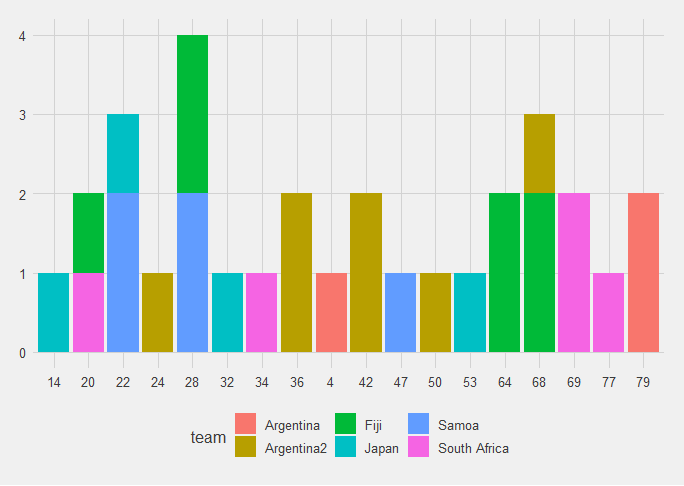
England played Argentina twice in this tournament, so I’ve labelled the 3rd place play-off team “Argentina2”. (England rugby league have done this to me before, so I was prepared.)

This Argentina team scored the joint most points against England at this tournament.

Bar chart of point scoring moments for teams playing against England, Fiji and Argentina2 are tied with the most with 7, followed by South Africa and Samoa with 5, then Japan with 4, and Argentina (from the first game) with 3.  Chile aren't on the chart because they didn't score.

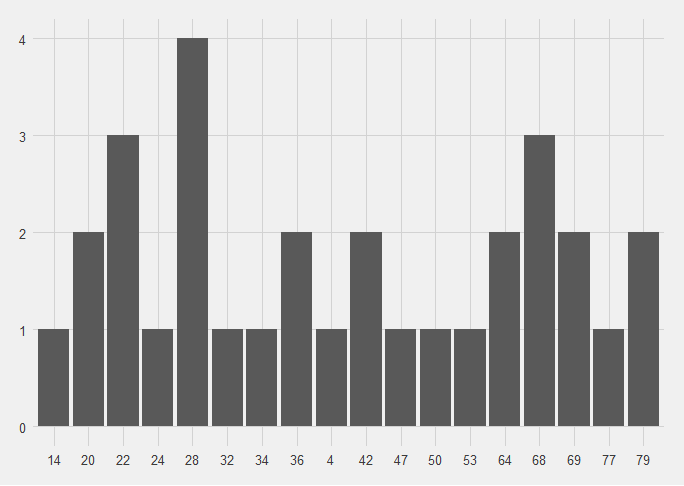
The pattern have of England conceding in minute 20-30 and 60-70 remained.

(Two more charts, one with when England conceded, and then that chart coloured by which team scored against England)

Bar chart of when England conceded.  The peak is at 28 minutes when 4 point-scoring moments were conceded.
Same chart as before, but now coloured by which team did the scoring.  Argentina from the first game are the red-pink, Argentina 2 the brown, Fiji the green, Japan blue, Samoa darker blue and South Africa pink.

Maro Itoje, Ben Earl and Joe Marchant were on the pitch for the most point-concession moments, but they were on the pitch a lot.

Bar chart showing how many point concessions England players were present for.  Highlights of data below.

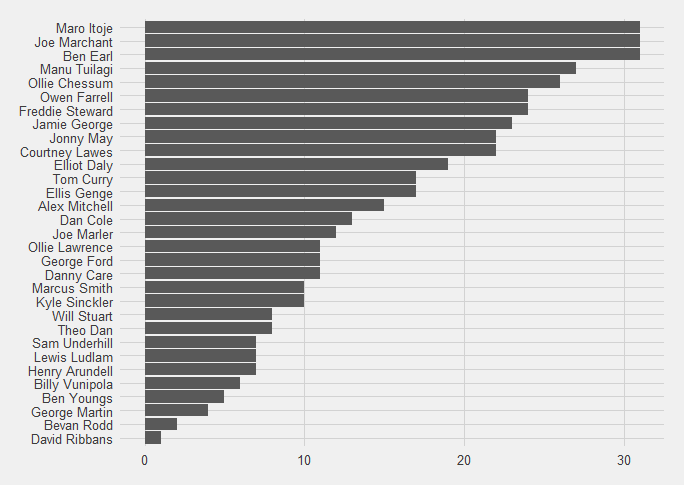
They were on for 31/31 point-conceding moments. David Ribbans, Bevan Rodd and George Martin (no, not that one) were present for the least, present for 1,2 and 4 point-conceding moments respectively.

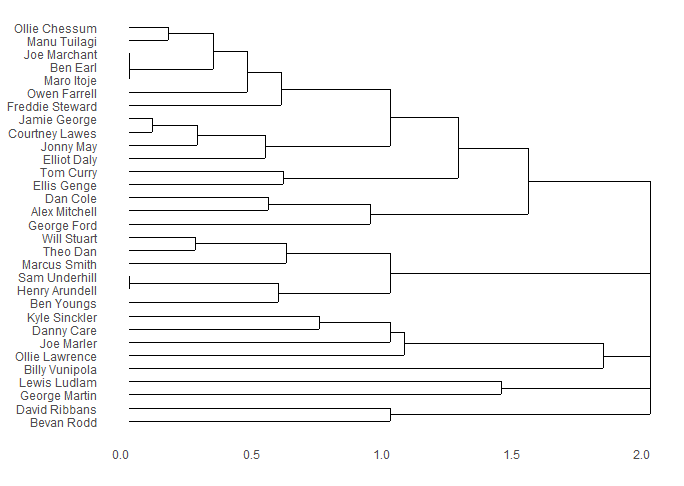
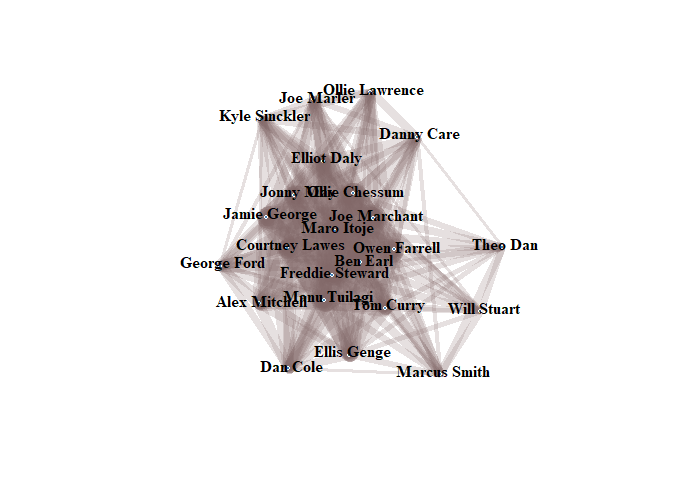
The dendrogram and the matrix for point-concessions are less clear.

Dendrogram of England players together when they conceded.  Very few clusters, one covering Marchant, Itoje and Earl, the other covering Sam Underhill and Harry Arundell (because Underhill's only game was vs Argentina 2, and Arundell only played in that game and the Chile game where England didn't concede).
Matrix diagram of players who played together when England conceded.  This again has the players together for the most in darker colours in the bottom right, but it fades to pale a lot quicker than the scoring matrix.

But the network diagram is fascinating, with the central 12 players giving a good idea of who Borthwick’s chosen are (Elliot Daly, Jonny May, Ollie Chessum, Jamie George, Joe Marchant, Maro Itoje, Courtney Lawes, Owen Farrell, Ben Earl, Freddie Stewart, Manu Tuilagi and Tom Curry).

Network diagram which looks like several concentric stars - there is a central 12 players, the most commonly together (Elliot Daly, Jonny May, Ollie Chessum, Jamie George, Joe Marchant, Maro Itoje, Courtney Lawes, Owen Farrell, Ben Earl, Freddie Stewart, Manu Tuilagi and Tom Curry).

Outside these are the next layer of "frequently played" (George Ford and Alex Mitchell), then the less frequently played but still often enough to feature (Kyle Sinckler, Joe Marler, Ollie Lawrence, Danny Care, Theo Dan, Will Stuart, Marcus Smith, Ellis Genge and Dan Cole).

I hope you’ve enjoyed reading these as much as I have making them.

One thought on “The road to explicableness – A closer look at England after their seventh World Cup game”

Leave a comment

This site uses Akismet to reduce spam. Learn how your comment data is processed.